#4 | Shan He | Driving transparency and urban design through mobility data
“Uber Movement provides anonymous data from over 2 billions of Uber trips that help urban planning and city planners from around the world to better understand their traffic patterns of their city.”
Shan he from Uber on how her data visualisation designs empower others to create better cities and urban designs. In this episode, we tap into the power of mobility data and how it can ultimately lead to a better citizen and city experience.
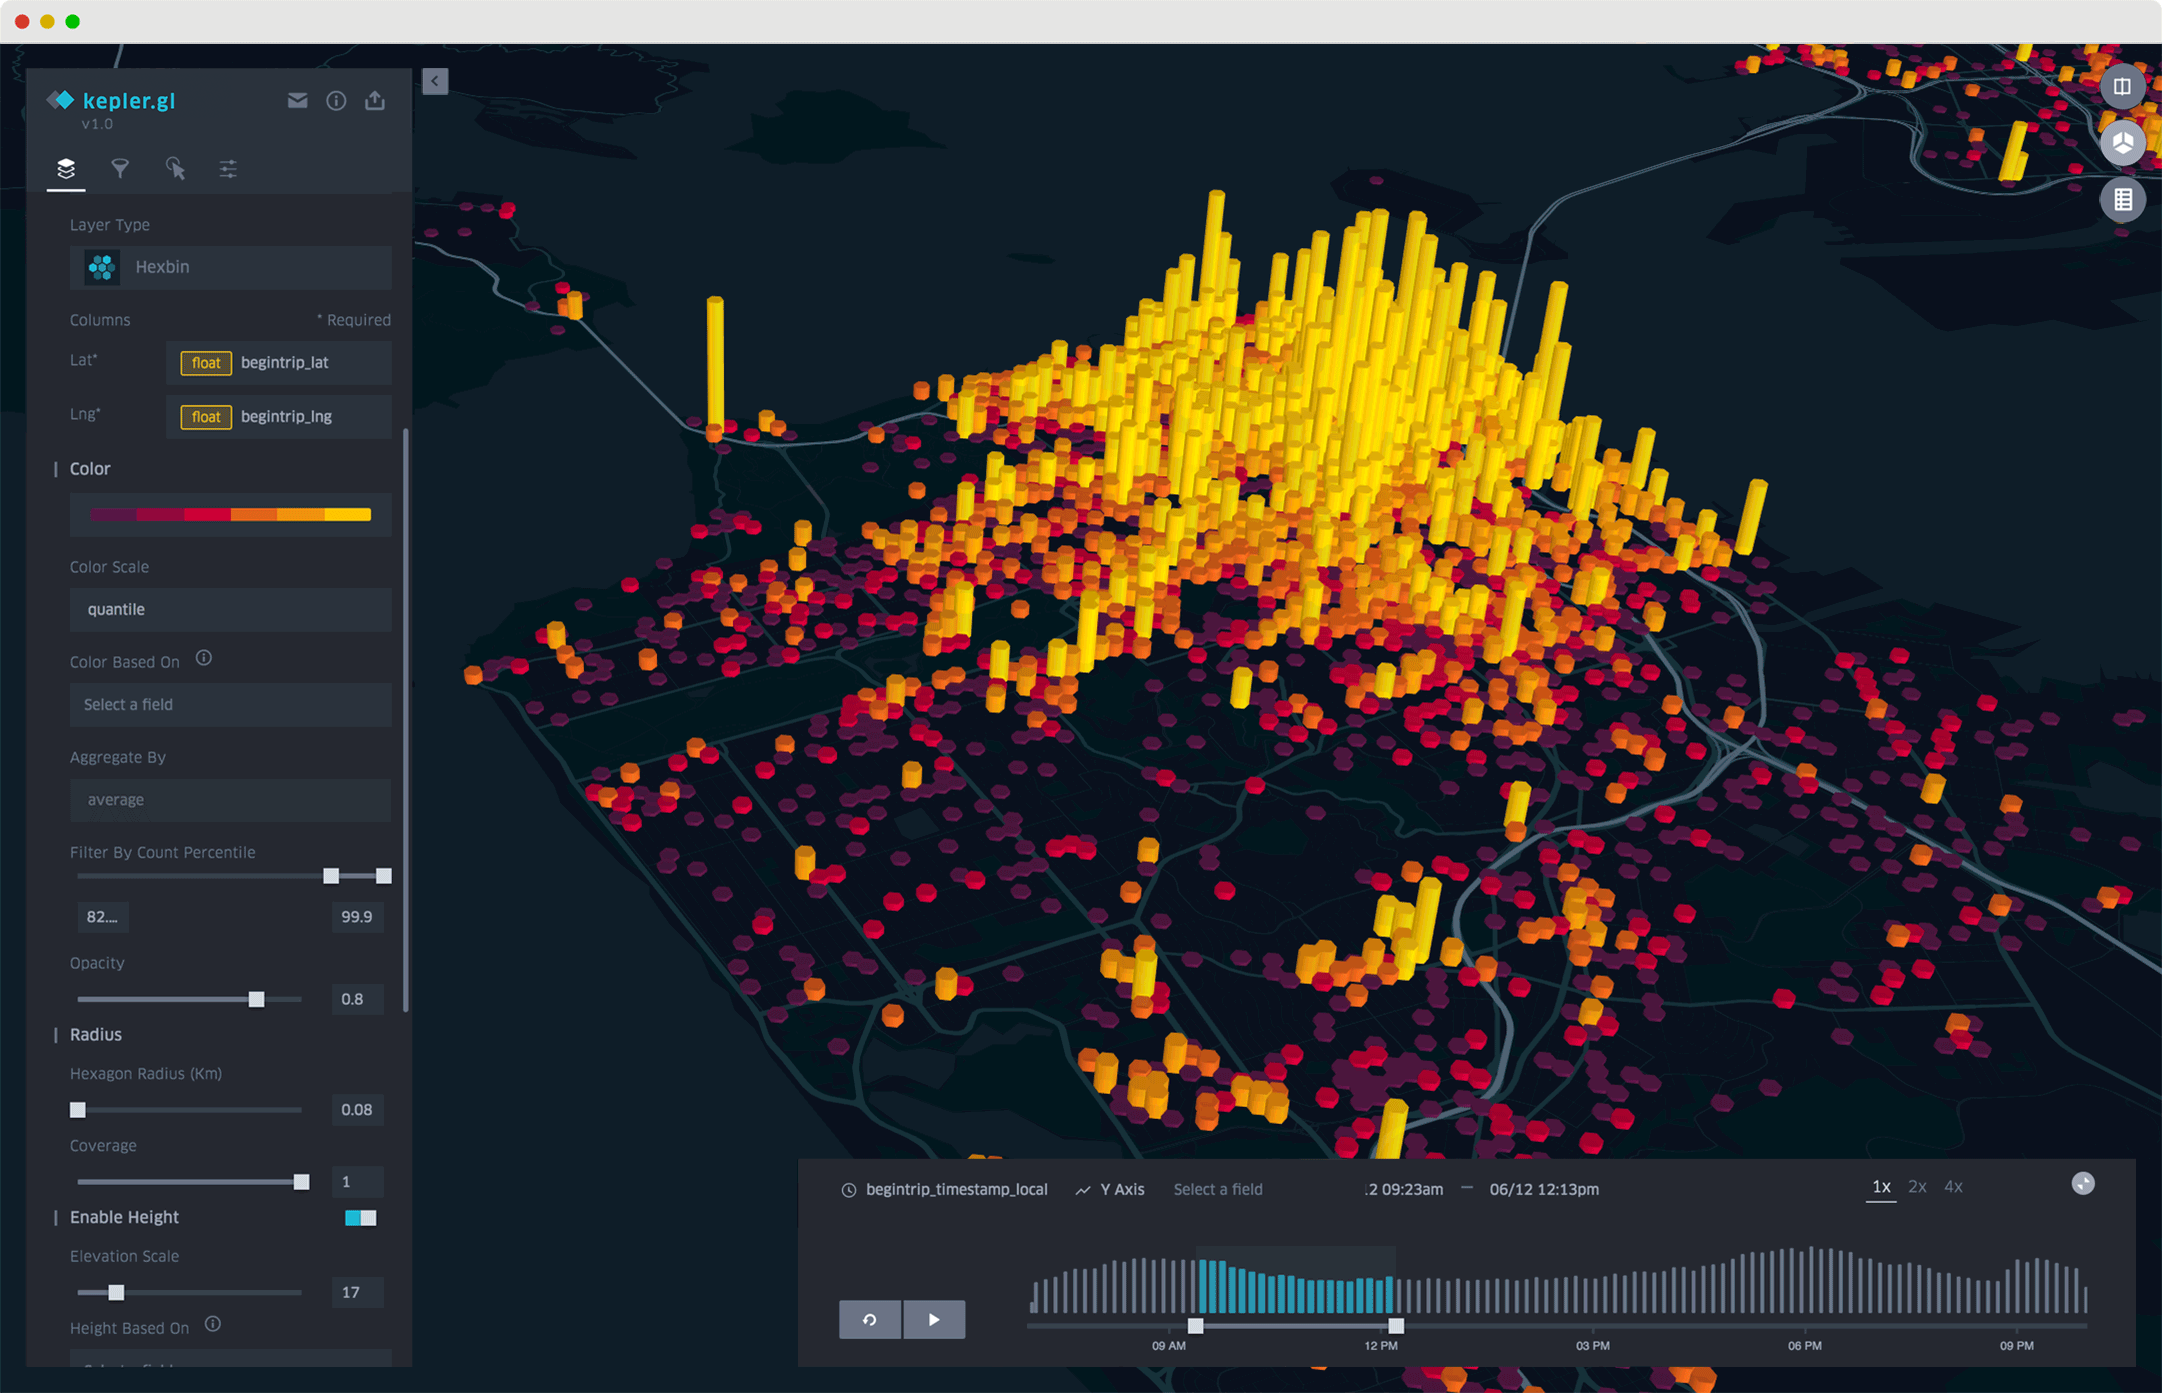
In this episode, we talk with Shan He from Uber, the founding member of Uber’s data visualisation team. Combing backgrounds in architectural generative design (gained in China) in the physical space with generative software design and data visualisation (learned at MIT) she created a new field that becomes increasingly important. By using geo-data and design visualisation tools she is able to design eye-opening visualisations that help in the communication of scientific findings and enable better decision making for cities and governments. Based on the data from Uber's global user in over 600 cities the visualisations can show when and how people move in the environment. In addition, her team developed an open source tool called “Kepler.gl” which gives everyone access to these powerful visualisations tools. Furthermore, the data is empowering research and science to easily create stunning infographics and presentations out of their data. For cities and urban planners its crucial to understand how people move, if they drive alone or with multiple people and understand citizen behaviour in general. Shan and her team work closely with cities to foster better and more strategic urban design. A talk exploring the intersection of design, data and cities of the future.
If you want to learn more about the tool Shan helped to develop and enables you to create powerful data visualisations click here: https://vis.gl


